What is Error 509
Appearance of error 509 in a browser
Error 509 Bandwidth Limit Exceeded is an HTTP status returned by a server or intermediary service (CDN) when requests are blocked due to exceeding a set traffic or request rate limit. Instead of content, the user sees the message:
509 Bandwidth Limit Exceeded
This error is not part of the standard HTTP/1.1 protocol (it is not officially encoded in an RFC), but it is widely used by hosting providers and CDNs as a custom status to indicate a resource limitation.
Causes of Error 509
Error 509 occurs at the infrastructure level, not the application level. Main causes:
- Exhaustion of traffic limit on hosting. Shared hosting plans often have strict quotas (e.g., 100 GB/month). Once exceeded, the host blocks access until the next billing cycle.
- Activation of CDN protection against attacks. Services like Cloudflare automatically enable blocking when they detect a traffic spike that may indicate a DDoS attack or scanning.
- Overly strict rate limiting settings. The web server (nginx, Apache) or WAF may have low thresholds set (e.g., 5 requests/sec per IP), which trigger on legitimate traffic.
- Resource abuse by the website itself. A faulty plugin, an infinite loop in code, or unoptimized database queries can generate a huge number of internal requests, exhausting the limit.
- Targeted attack. A DDoS attack or botnet can create thousands of requests per second, instantly exceeding any reasonable limits.
How to Fix Error 509: Step-by-Step Guide
Step 1: Identify the Source of the Error
First, determine who is returning the 509 error: your hosting provider, CDN, or web server.
- Check the HTTP response headers. Open DevTools in your browser (F12), go to the Network tab, refresh the page, and find the request that returned 509. Examine the headers:
Server: cloudflare— the error is from Cloudflare.Server: nginxorApache— rate limiting on your server may have triggered.- Headers like
X-Cache: ErrororX-Host:often contain information about intermediary services.
- Use the
curlcommand. Runcurl -I https://your-site.ruin a terminal. The output will show all headers. - Check the logs. In your hosting control panel, find the logs section (Logs, Access Logs). If the host is generating the error, there will be a corresponding entry. For SSH access, logs are typically in
/var/log/nginx/(access.log, error.log) or/var/log/apache2/.
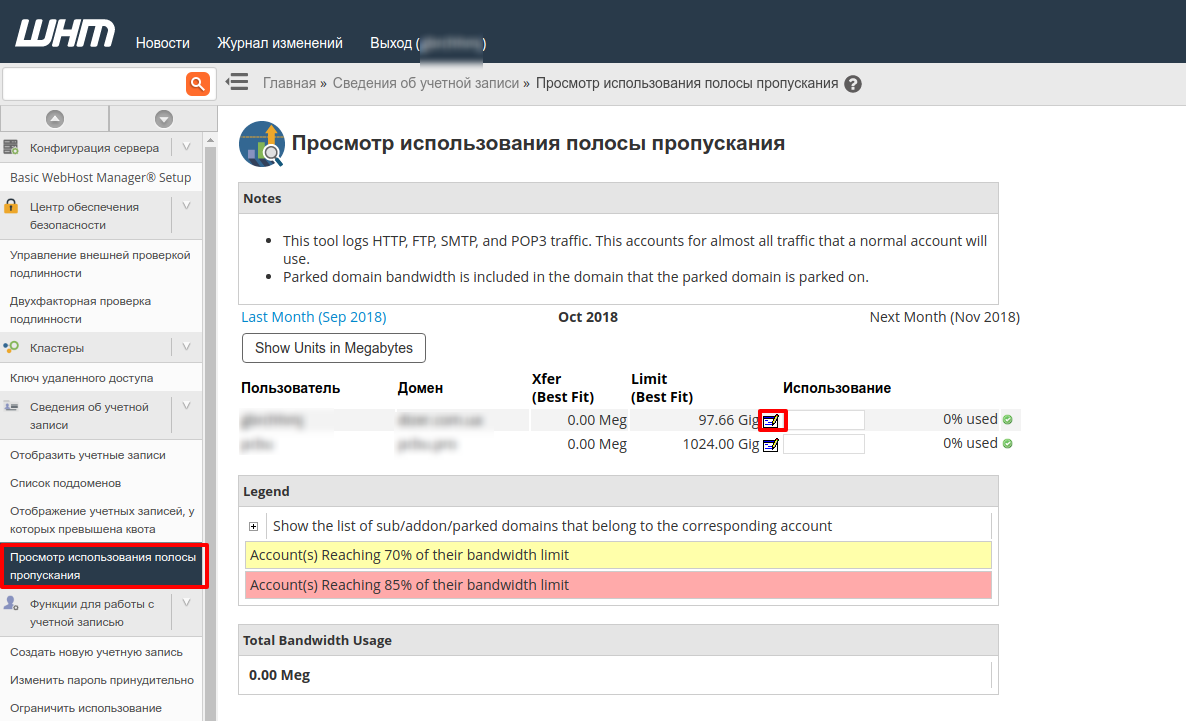
Step 2: Check and, if necessary, Increase Hosting Limits
If the source is your hosting, the traffic quota for your plan has been exceeded.
- Log into your hosting control panel (cPanel, Plesk, ISPManager).
- Find the Traffic, Bandwidth Usage, or Statistics section.
- Look at the graph or figures for the current month/day. Compare them to your plan's limit.
- If the limit is exceeded:
- Temporary solution: In some panels (e.g., cPanel), you can temporarily increase the limit in settings. If no such option exists, contact your hosting support immediately and ask them to lift the block until the end of the billing period (this is often a paid service).
- Long-term solution: Consider upgrading to a plan with higher or unlimited traffic (VPS, dedicated server). On shared hosting, limits are usually strict.
- After the block is lifted, check if the site works. Clear your browser cache and, if you use one, your site/CDN cache.
💡 Tip: Set up email notifications in your hosting panel when you reach 80-90% of your limit. This gives you time to react.
Step 3: Configure Rate Limiting in the Web Server
If the issue is bot traffic or overly aggressive server settings, tighten or, conversely, relax the limits.
For nginx:
- Open the virtual host configuration file (usually
/etc/nginx/sites-available/your-site). - In the
httpblock (globally) orserverblock (for a specific site), define a limiting zone. Parameters:$binary_remote_addr— the key used to track traffic (IP address in binary form).zone=perip:10m— the zone name and memory size (10M is enough for ~160k IPs).rate=10r/s— the base limit (10 requests per second per IP).
http { limit_req_zone $binary_remote_addr zone=perip:10m rate=10r/s; } - In the
locationblock you want to protect (oftenlocation /), apply the zone:location / { limit_req zone=perip burst=20 nodelay; # ... other directives (proxy_pass, root, etc.) }burst=20— allows short bursts of up to 20 requests.nodelay— does not delay requests in a queue; instead, it immediately rejects those that exceed the limit.
- Check the syntax:
sudo nginx -t. - Reload the configuration:
sudo systemctl reload nginx.
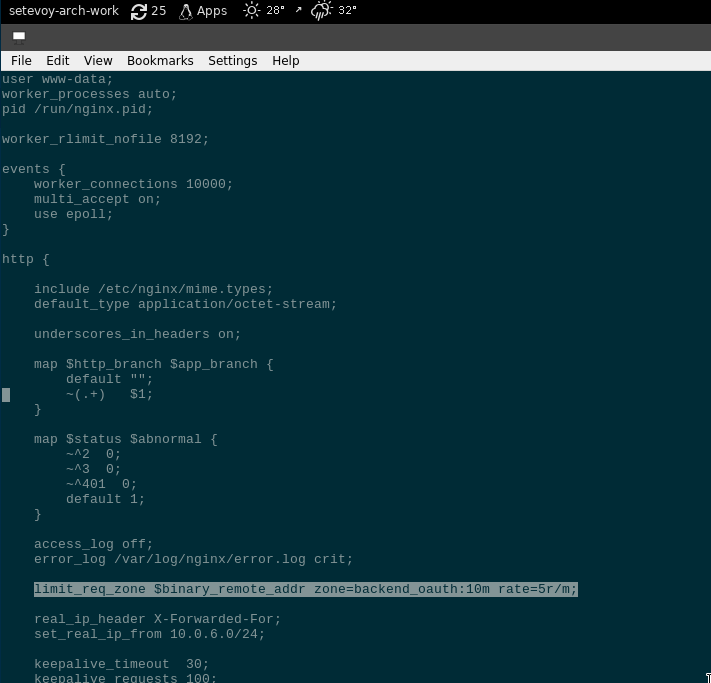
Example of rate limiting configuration in nginx
For Apache (with the mod_evasive module):
- Ensure the module is enabled:
sudo a2enmod evasive. - Edit the module's config file (usually
/etc/apache2/mods-available/evasive.conf):
Start with<IfModule mod_evasive20.c> DOSHashTableSize 3097 DOSPageCount 2 # Max requests to a single page per interval DOSSiteCount 50 # Max requests to the site per interval DOSPageInterval 1 # Interval for DOSPageCount (seconds) DOSSiteInterval 1 # Interval for DOSSiteCount (seconds) DOSBlockingPeriod 10 # Blocking period in seconds </IfModule>DOSSiteCount 50andDOSSiteInterval 1(50 requests/sec for the entire site). Adjust based on your load. - Reload Apache:
sudo systemctl reload apache2.
Step 4: Configure Protection in the CDN
If the error source is your CDN (Cloudflare, Sucuri), configure its security rules.
Cloudflare:
- Log into the Cloudflare dashboard, select your domain.
- Quick protection: In Security → Settings, set Security Level to Medium or High. This enables stricter JavaScript checks and Challenges for suspicious traffic.
- Fine-grained control: Go to Security → WAF.
- On the Rate limiting tab, click Create rate limiting rule.
- Specify a URL (e.g.,
/wp-login.php,/xmlrpc.php, or*for the entire site). - Set a Limit (e.g., 10 requests) and Period (1 minute).
- In Action, choose Block or Challenge (show a CAPTCHA).
- Save the rule.
- Wait 5-10 minutes for rules to propagate, then test your site.
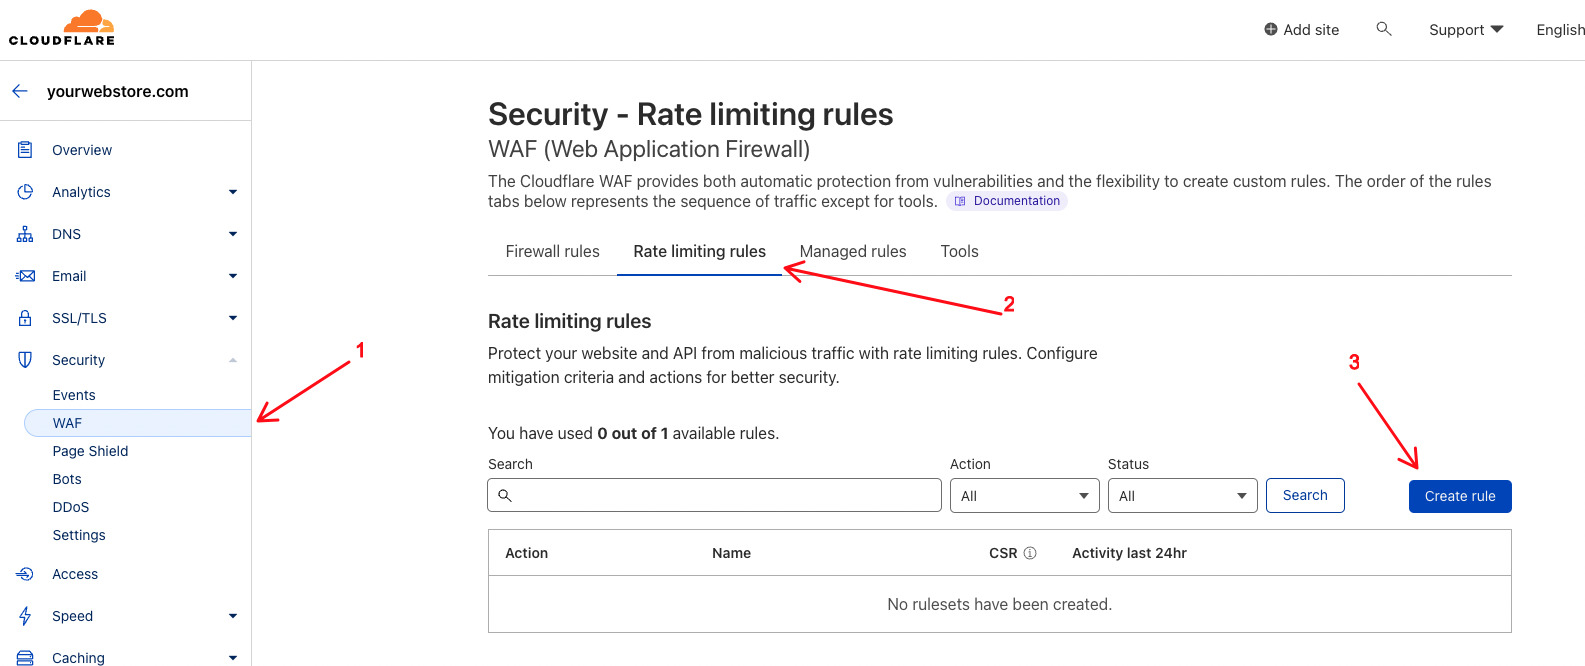
Configuring a Rate Limiting rule in Cloudflare
Sucuri:
- In the Sucuri dashboard, go to Firewall → Settings.
- Find the Rate Limiting section.
- Set limits on the number of requests to the site per minute/hour. Recommended starting values: 60-100 requests/minute per IP.
- Save settings.
⚠️ Important: Limits that are too low (e.g., 1-2 requests/sec) can block regular users during rapid clicking or when loading a page with many resources. Test your changes.
Step 5: Optimize the Site and Check Plugins
Often, error 509 is a symptom of a poorly performing website that generates excessive requests.
- Reduce the number of HTTP requests:
- Combine CSS and JavaScript files.
- Use CSS sprites for icons.
- Enable lazy loading for images.
- Enable server-side compression and caching:
- gzip/Brotli: In nginx, add
gzip on;andbrotli on;to your config. - Static file caching: Set
Cache-Control: max-age=31536000headers for images, CSS, JS.
- gzip/Brotli: In nginx, add
- Check CMS plugins/modules (especially for WordPress, Joomla):
- Temporarily disable all plugins via the admin area.
- Check if the 509 error disappears.
- Enable plugins one by one to find the culprit. Common "suspects": analytics plugins, anti-spam plugins, AJAX widgets, "on-the-fly" image optimization plugins.
- Update the problematic plugin or find an alternative.
- Database audit: For WordPress, use plugins like WP-Optimize to clean up transients, spam comments, and optimize tables.
Preventing Error 509 from Recurring
- Traffic monitoring and alerts:
- Use analytics (Google Analytics, Matomo) and hosting tools.
- Set up alerts (via services like UptimeRobot or built-in Cloudflare features) when reaching 80% of your traffic limit or during a sudden spike in requests.
- Regular log analysis:
- Weekly, check the top IPs by request count:
sudo cat /var/log/nginx/access.log | awk '{print $1}' | sort | uniq -c | sort -nr | head -20. - Look for suspicious User-Agents (e.g.,
masscan,zgrab,sqlmap) or frequent requests to/wp-login.php,/xmlrpc.php.
- Weekly, check the top IPs by request count:
- Use a CDN with DDoS protection:
- Even Cloudflare's free plan offers basic protection. Enable Bot Fight Mode.
- During a real attack, activate Under Attack Mode (Cloudflare) — it shows a JavaScript Challenge to all visitors for 5 minutes.
- Optimize content:
- Compress images before uploading (TinyPNG, ImageOptim).
- Minify CSS/JS (CMS plugins or tools like UglifyJS).
- Configure long-term caching for static resources.
- Keep all software updated:
- CMS, themes, plugins, web server (nginx/Apache). Outdated software often contains vulnerabilities exploited to create botnets.
When to Contact Hosting Support
If rate limiting and CDN configurations don't help, and hosting limits are not exhausted, the problem may be deeper (e.g., in the provider's network infrastructure). In this case:
- Gather data:
- Exact time and duration of the error.
- Screenshot of the error from the browser.
- Output of
curl -Iand key lines from logs (access.log, error.log) during the error period. - Results of your diagnosis (which source was identified: hosting/CDN/server).
- Formulate your support request:
- "My site is returning a 509 error. Based on headers, the source appears to be your hosting/server."
- "Please check if any traffic/request limits on my plan state plan name have been exceeded?"
- "Are there any log entries about blocking by rule rule name, if you configured one?"
- "Can you temporarily lift the block and provide extended logs for analysis?"
- What support can do:
- Lift a temporary block.
- Suggest a more suitable plan.
- Configure more flexible limits on the infrastructure side (if allowed by your plan).
- Provide access to extended logs (e.g., via Log Manager in cPanel).
If your host cannot or will not resolve the issue and your site is business-critical, consider migrating to a provider with transparent limits and quality support.